Single predictor models
Contents
Single predictor models
Single predictor models investigating the effect of a range of lower- and higher-level visual and auditory predictors. Analyses are run using Neuroscout’s pyNS interaface for the Neuroscout API. Identical analyses are specified for each dataset / task combination.
from collections import defaultdict
from pyns import Neuroscout
from pathlib import Path
from create import create_models

import sys
sys.path.append("..")
from utils import dump_collection, load_collection

%matplotlib inline
/Users/rr48396/opt/anaconda3/lib/python3.7/site-packages/nilearn/datasets/__init__.py:96: FutureWarning: Fetchers from the nilearn.datasets module will be updated in version 0.9 to return python strings instead of bytes and Pandas dataframes instead of Numpy arrays.
  "Numpy arrays.", FutureWarning)
api = Neuroscout()
Define predictors and confounds
predictors = ['speech', 'rms', 'text', 'brightness', 'shot_change', 'landscape', 'building', 'tool']
confounds = [
    'a_comp_cor_00', 'a_comp_cor_01', 'a_comp_cor_02', 'a_comp_cor_03', 'a_comp_cor_04', 'a_comp_cor_05',
    'trans_x', 'trans_y', 'trans_z', 'rot_x', 'rot_y', 'rot_z'
]
datasets = api.datasets.get() # Get all Neuroscout datasets
Create models
The following will create a neuroscout analysis for every dataset/task that and predictor combination.
Uncomment the follwing line to re-execute and re-create models for the logged in acccount.
filename = Path('models') / 'single_predictor.json'
# single_models = defaultdict(list)
# for pred in predictors:
#     single_models[pred] = create_models(name=pred, predictors=[pred], confounds=confounds, datasets=datasets)

# Save models out to disk:
# dump_collection(single_models, filename)
# Load models from cache
single_models = load_collection(filename)
# Three models for "building" Clarifai visual predictor
single_models['building'][0:3]
[{'dataset': 'Budapest',
  'task': 'movie',
  'hash_id': 'A13DD',
  'analysis': <Analysis hash_id=A13DD name=building dataset_id=27>},
 {'dataset': 'LearningTemporalStructure',
  'task': 'movie',
  'hash_id': 'AVrDK',
  'analysis': <Analysis hash_id=AVrDK name=building dataset_id=19>},
 {'dataset': 'Life',
  'task': 'life',
  'hash_id': 'Ar6D0',
  'analysis': <Analysis hash_id=Ar6D0 name=building dataset_id=9>}]
We can inspect the BIDS StatsModel generate for any analysis.
For example: building for the Budapest dataset:
# BIDS StatsModel generated for a single analysis.
# In this case, "studyforrest" for the "building" feature
single_models['building'][-1]['analysis'].model
{'Input': {'Run': [1, 2, 3, 4, 5, 6, 7, 8],
  'Subject': ['10',
   '19',
   '04',
   '03',
   '01',
   '18',
   '15',
   '09',
   '16',
   '14',
   '05',
   '20',
   '06'],
  'Task': 'movie'},
 'Name': 'building',
 'Steps': [{'Contrasts': [],
   'DummyContrasts': {'Conditions': ['building'], 'Type': 't'},
   'Level': 'Run',
   'Model': {'X': ['a_comp_cor_00',
     'a_comp_cor_01',
     'a_comp_cor_02',
     'a_comp_cor_03',
     'a_comp_cor_04',
     'a_comp_cor_05',
     'trans_x',
     'trans_y',
     'trans_z',
     'rot_x',
     'rot_y',
     'rot_z',
     'building']},
   'Transformations': [{'Input': ['building'], 'Name': 'Convolve'}]},
  {'DummyContrasts': {'Type': 'FEMA'}, 'Level': 'Subject'},
  {'DummyContrasts': {'Type': 't'}, 'Level': 'Dataset'}]}
Generate reports
For every individual analysis created, we can generate reports to inspect the design matrix
analysis = single_models['building'][0]['analysis']
analysis.generate_report(run_id=analysis.runs[0]) # Only generate for a single example run, to save time
{'generated_at': '2022-03-28T07:2',
 'result': None,
 'sampling_rate': None,
 'scale': False,
 'status': 'PENDING',
 'traceback': None,
 'warnings': []}
analysis.plot_report(plot_type='design_matrix_plot')
analysis.plot_report(plot_type='design_matrix_corrplot')
Compile models
The following will “compile” every created model, validating the model and producing an executable bundle
for pred, models in single_models.items():
    for model in models:
        # If analysis is still in "DRAFT" model, compile it.
        if model['analysis'].get_status()['status'] == 'DRAFT':
            model['analysis'].compile()
Model Execution
Models can be executed using Neuroscout-CLI. For more information see the Neuroscout documentation.
For example, to re-run the following model using Docker:
single_models['building'][0]
{'dataset': 'Budapest',
 'task': 'movie',
 'hash_id': 'A13DD',
 'analysis': <Analysis hash_id=A13DD name=building dataset_id=27>}
Use the following command:
docker run --rm -it -v /home/results/:/out neuroscout/neuroscout-cli run --force-upload A13DD /out
This will download the bundle for M8LYl, the necessary preprocessed imaging data from the Budapest dataset, run the analysis workflow and upload results to NeuroVault (even if an upload already exists).
Results
All results are indexed by Neuroscout after execution, and the resulting statistical images are archived in NeuroVault.
Let’s take a look at a single analysis as an example: "building" feature for the "Budapest" datsaetg
single_models['building'][0]
{'dataset': 'Budapest',
 'task': 'movie',
 'hash_id': 'A13DD',
 'analysis': <Analysis hash_id=A13DD name=building dataset_id=27>}
We can view this analysis and the associated uploads interactively using Neuroscout’s website at this URL: https://neuroscout.org/builder/A13DD
Alternatively, we can download the associated images and display them like here using the Python tools.
The following will download the images matching image_filters for the latest associated NeuroVault collection and plot the results using nilearn.plotting
DOWNLOAD_DIR = Path('./images')
analysis.plot_uploads(download_dir=DOWNLOAD_DIR,
                      image_filters={'stat': 't', 'space': 'MNI152NLin2009cAsym', 'level': 'GROUP'},
                      plot_args={'threshold':3})
/Users/rr48396/opt/anaconda3/lib/python3.7/site-packages/nilearn/plotting/img_plotting.py:341: FutureWarning: Default resolution of the MNI template will change from 2mm to 1mm in version 0.10.0
  anat_img = load_mni152_template()
[<nilearn.plotting.displays.OrthoSlicer at 0x7ff1f4eb9f10>]

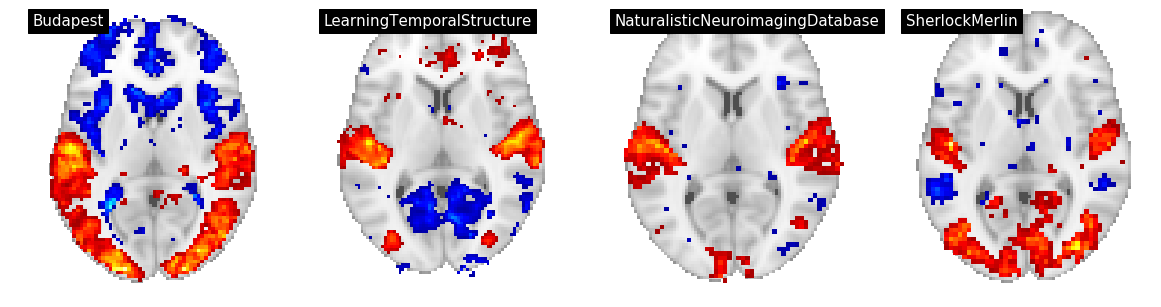
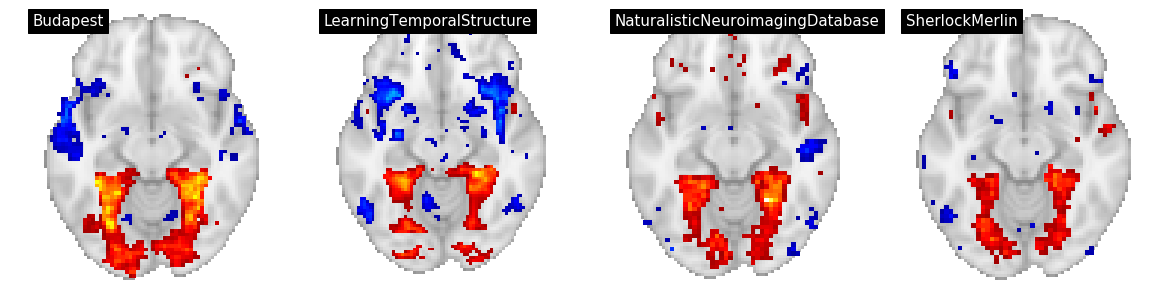
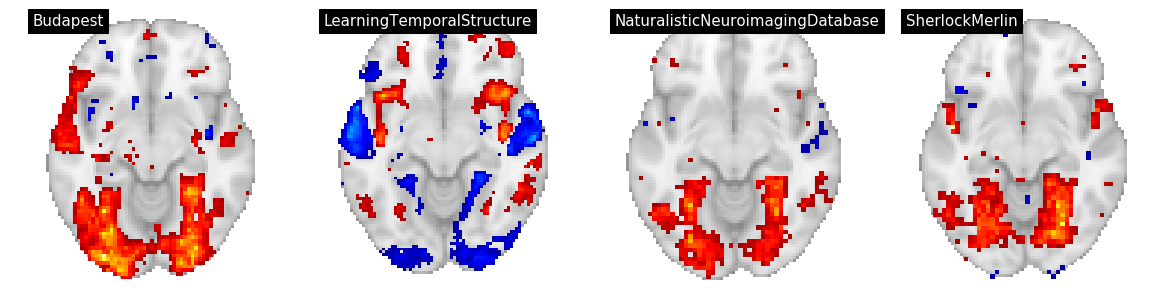
Figure 4
In Figure 4, we display three features: building, text, and rms for for datasets/tasks: Sherlock/SherlockMovie, LearningTemporalStructure/movie, NaturalisticNeuroimagingDatabase/500daysofsummer and studyforrest/movies.
We convert the group level t maps to z maps, threshold at p<0.001, and and plot using nilearn on a grid
from nilearn.glm import threshold_stats_img
from nilearn.plotting import plot_stat_map
import matplotlib.pyplot as plt
from utils import t_to_z
plot_args = dict(colorbar=False, display_mode='z', cut_coords=[-12], vmax=15, annotate=False)
contrast = 'building'

fig, axs = plt.subplots(ncols=4, nrows=1, figsize=(20, 5))

i = 0
for an in single_models[contrast]:
    # Only plot for 4 tasks
    if an['task'] in ['SherlockMovie', 'movie', '500daysofsummer'] and an['dataset'] not in ['studyforrest']:
        ax = axs[i]
        i += 1
        # Download images matching filters
        t_map, metadata = an['analysis'].load_uploads(
                image_filters={'stat': 't', 'space': 'MNI152NLin2009cAsym'},
                download_dir=DOWNLOAD_DIR)[0]

        # Convert to Z maps, and compute threshold at p<0.001
        n_subjects = len(an['analysis'].model['Input']['Subject'])
        z_map = t_to_z(t_map, n_subjects-1)
        thresh_z_map, thresh = threshold_stats_img(z_map, alpha=0.001)

        # Plot
        plot_stat_map(thresh_z_map, threshold=thresh, title=f"{an['dataset']}", **plot_args, axes=ax)
...
plot_args = dict(colorbar=False, display_mode='z', cut_coords=[-10], vmax=15, annotate=False)
contrast = 'text'
fig, axs = plt.subplots(ncols=4, nrows=1, figsize=(20, 5))

i = 0

for an in single_models[contrast]:
    if an['task'] in ['SherlockMovie', 'movie', '500daysofsummer'] and an['dataset'] not in ['studyforrest']:
        ax = axs[i]
        i += 1
        t_map, metadata = an['analysis'].load_uploads(
                image_filters={'stat': 't', 'space': 'MNI152NLin2009cAsym'},
                download_dir=DOWNLOAD_DIR)[0]
        n_subjects = len(an['analysis'].model['Input']['Subject'])
        z_map = t_to_z(t_map, n_subjects-1)
        thresh_z_map, thresh = threshold_stats_img(z_map, alpha=0.001)
        plot_stat_map(thresh_z_map, threshold=thresh, **plot_args, title=f"{an['dataset']}", axes=ax)
....
plot_args = dict(colorbar=False, display_mode='z', cut_coords=[6], vmax=15, annotate=False)
contrast = 'rms'
fig, axs = plt.subplots(ncols=4, nrows=1, figsize=(20, 5))

i = 0

for an in single_models[contrast]:
    if an['task'] in ['SherlockMovie', 'movie', '500daysofsummer'] and an['dataset'] not in ['studyforrest']:
        ax = axs[i]
        i += 1
        t_map, metadata = an['analysis'].load_uploads(
                image_filters={'stat': 't', 'space': 'MNI152NLin2009cAsym'},
                download_dir=DOWNLOAD_DIR)[0]
        n_subjects = len(an['analysis'].model['Input']['Subject'])
        z_map = t_to_z(t_map, n_subjects-1)
        thresh_z_map, thresh = threshold_stats_img(z_map, alpha=0.001)
        plot_stat_map(thresh_z_map, threshold=thresh, **plot_args, title=f"{an['dataset']}", axes=ax)
....